VIDEA: VIDEA TRANSACT

BACKGROUND
Videa was a start-up company under Cox Media Group. Videa partnered with TV station groups to optimize their inventory on a supply-side platform.
PRODUCT
Videa Transact, was a live marketplace of full scheduling, reservation, and pricing of television inventory. Stations automated and managed their inventories, optimized advertising campaigns, established workflow efficiencies with advertising agencies and offered data-enhanced audience targeting.
ROLE
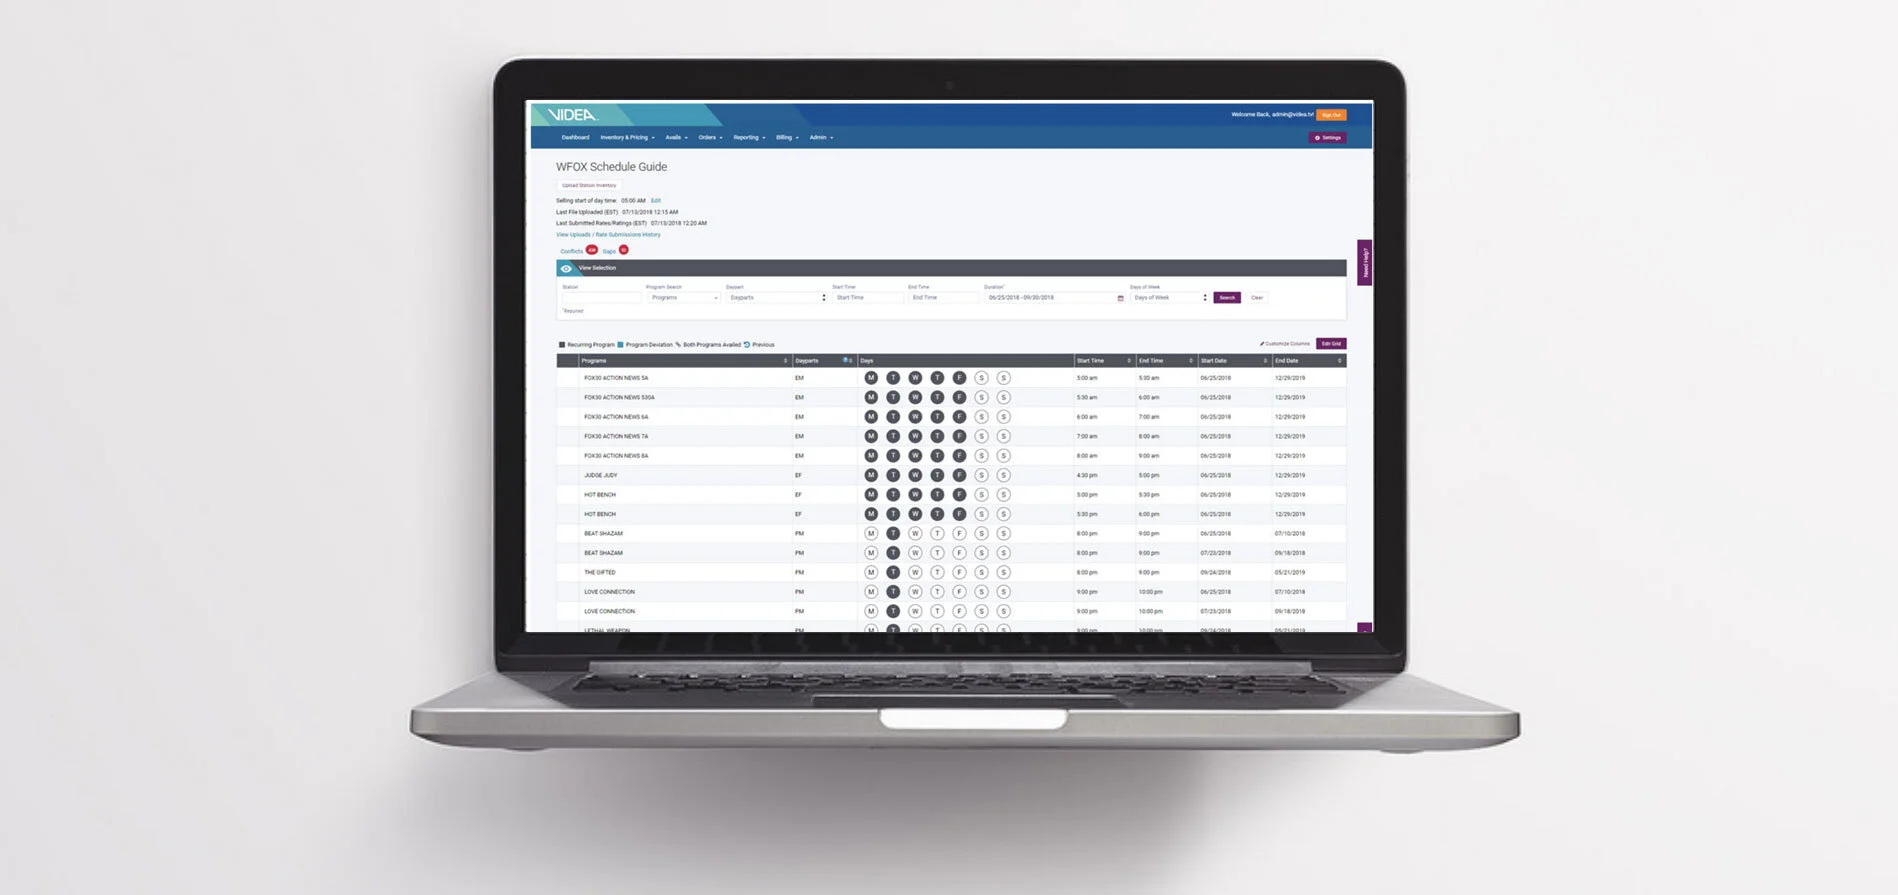
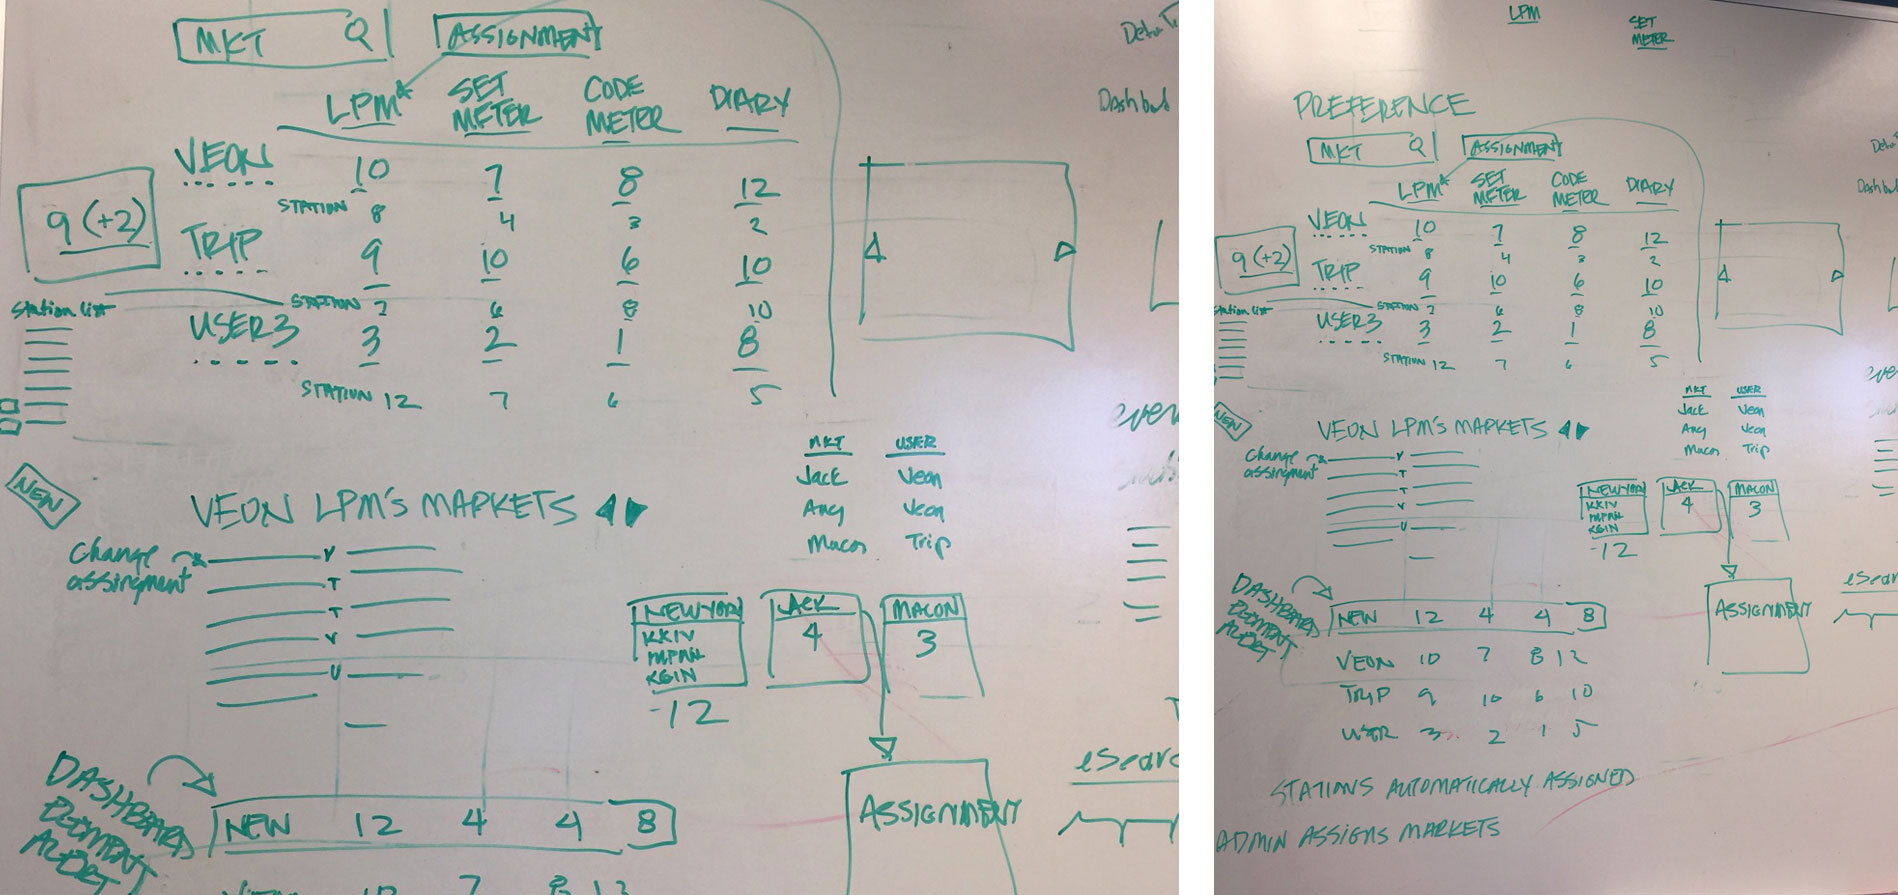
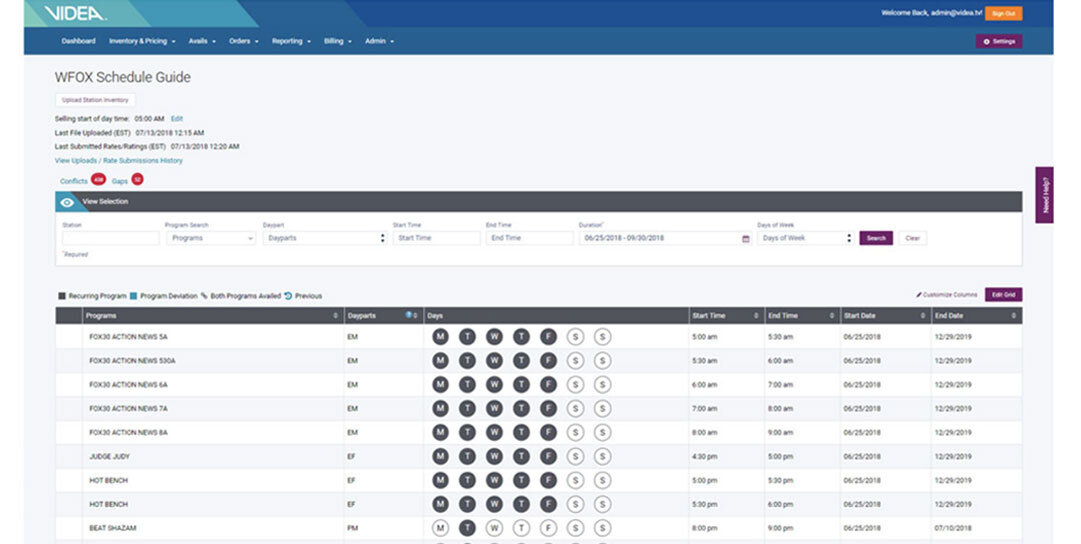
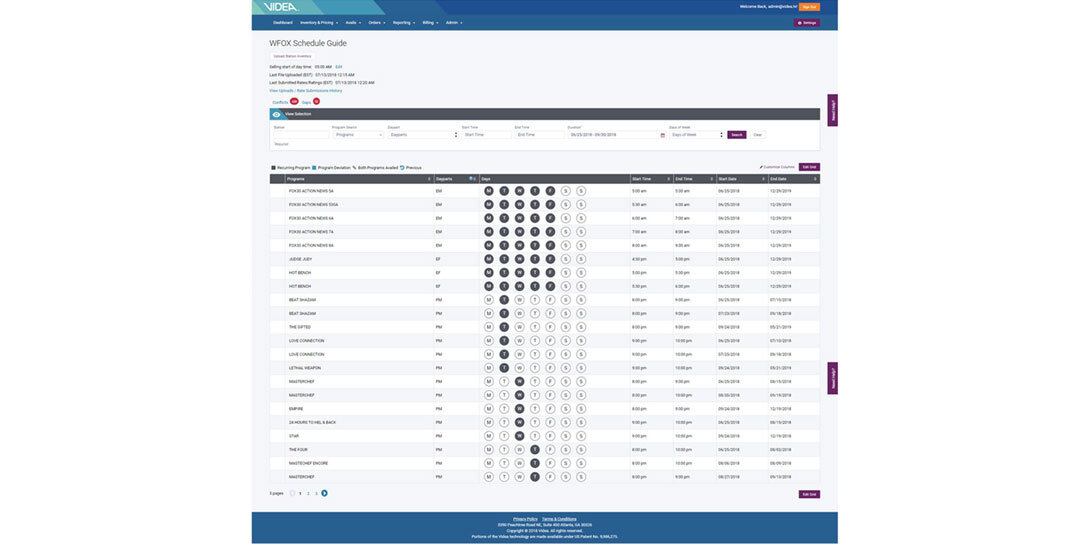
INVENTORY SCHEDULE GUIDE: Designed the Inventory Schedule Guide which maximized the stations groups inventory schedule with access to four years of historical data. In addition, it enabled stations to sell their inventory based on unique sales strategy and reserved broadcast inventory weeks or quarters in advance.
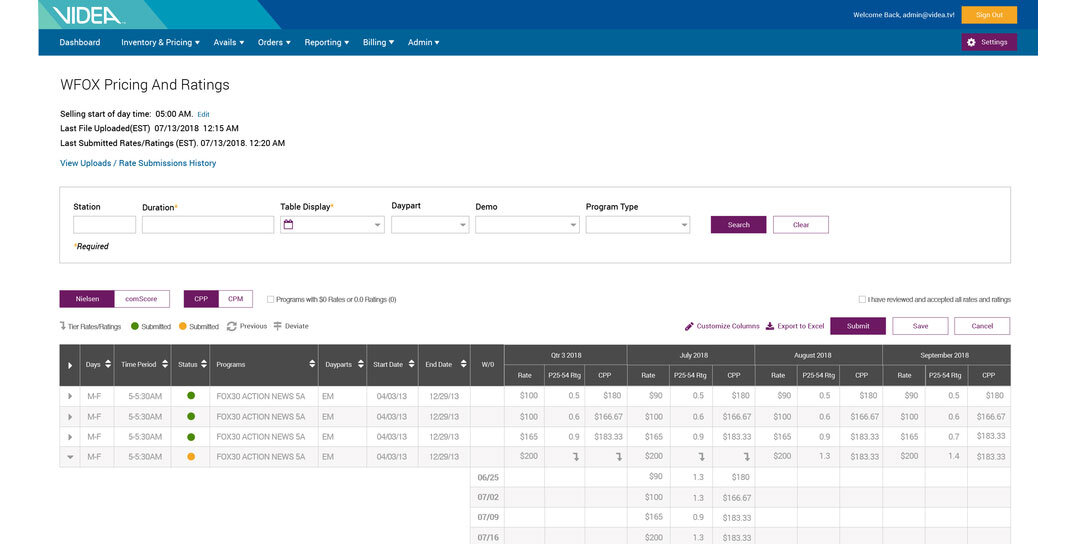
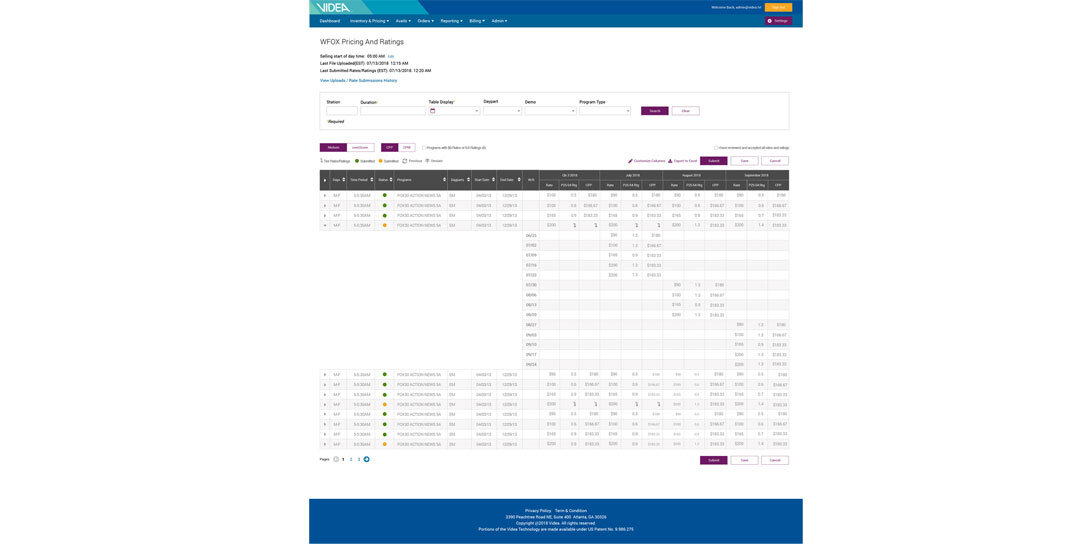
PRICING AND RATING: Designed the Pricing and Rating interface that allowed stations to reduce their manual research processes with built-in, data-driven ratings research from Nielsen and Rentrak. Stations sold more spot TV inventory at scale with approved controlled pricing.
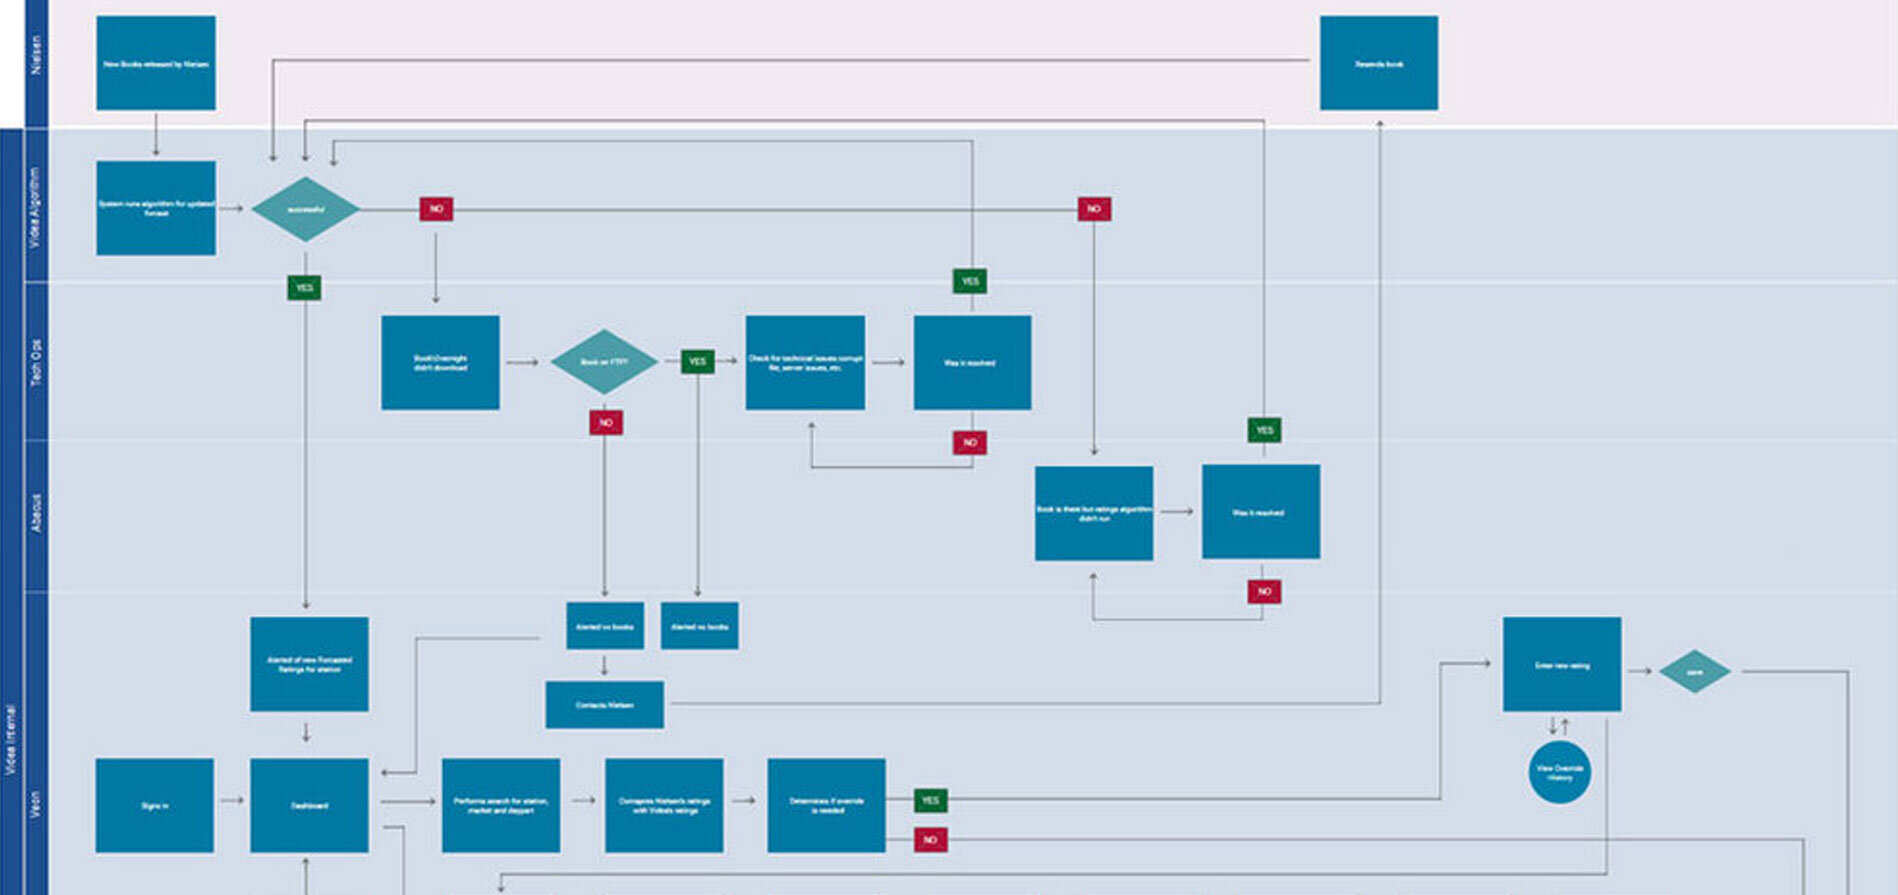
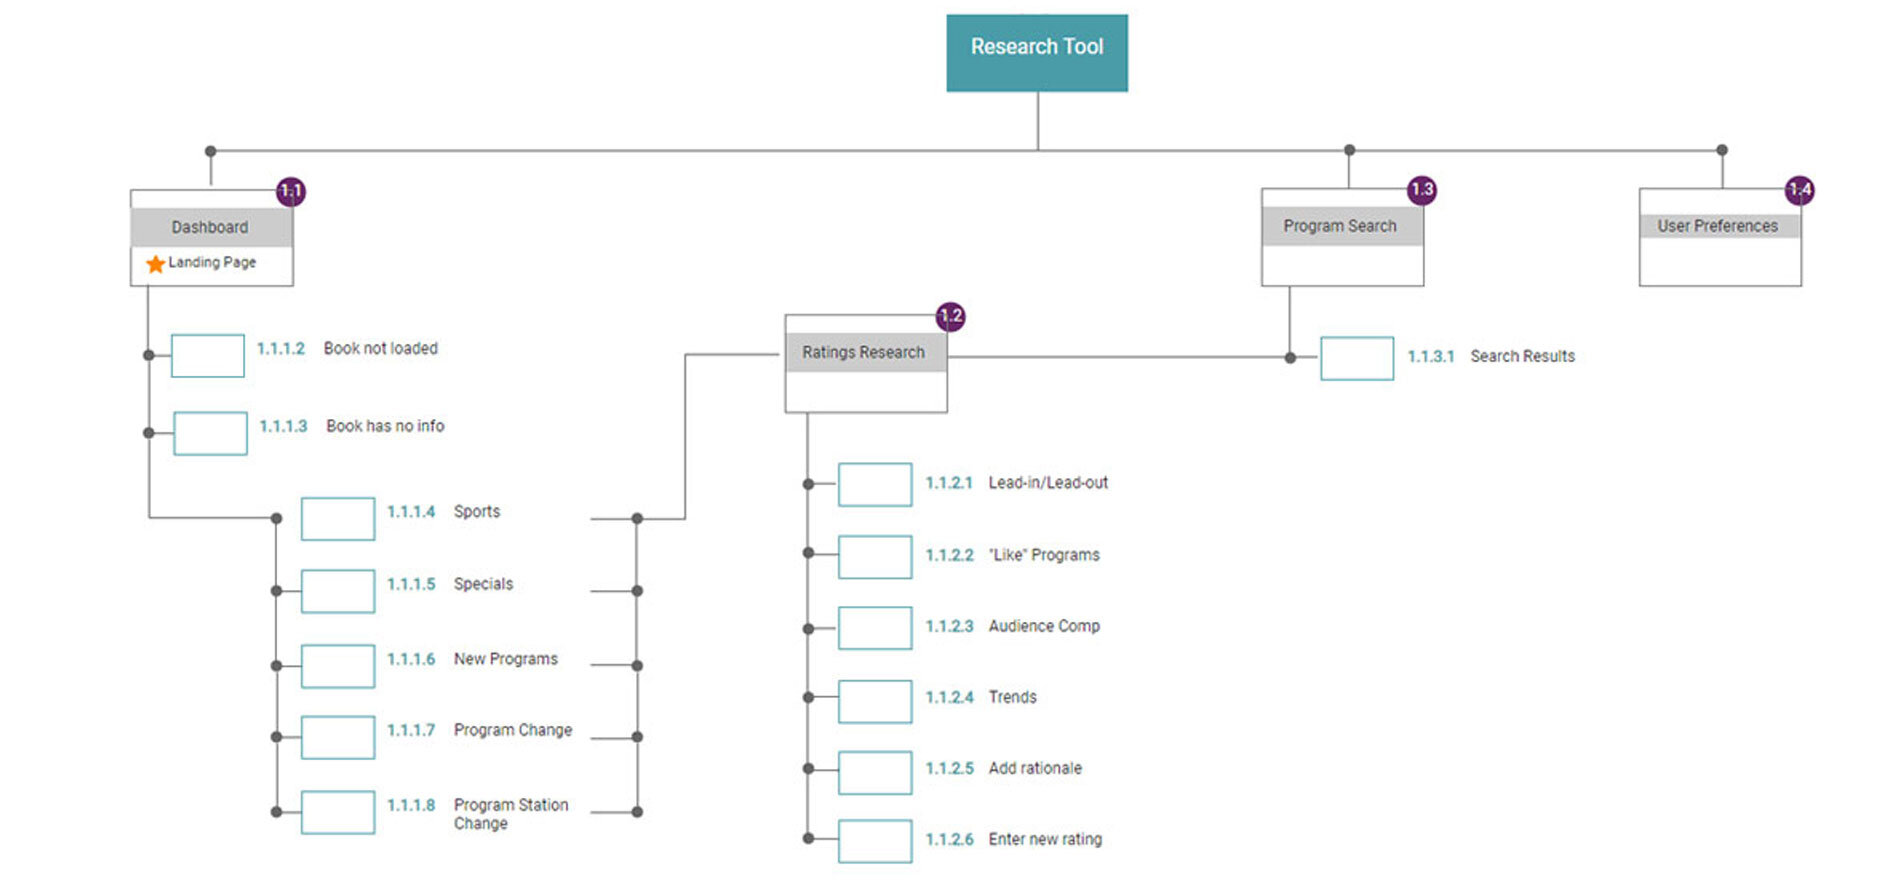
RESEARCH TOOL: Designed Research Tool for internal researchers to project ratings of demographics, track trends in markets and maintain data integrity.
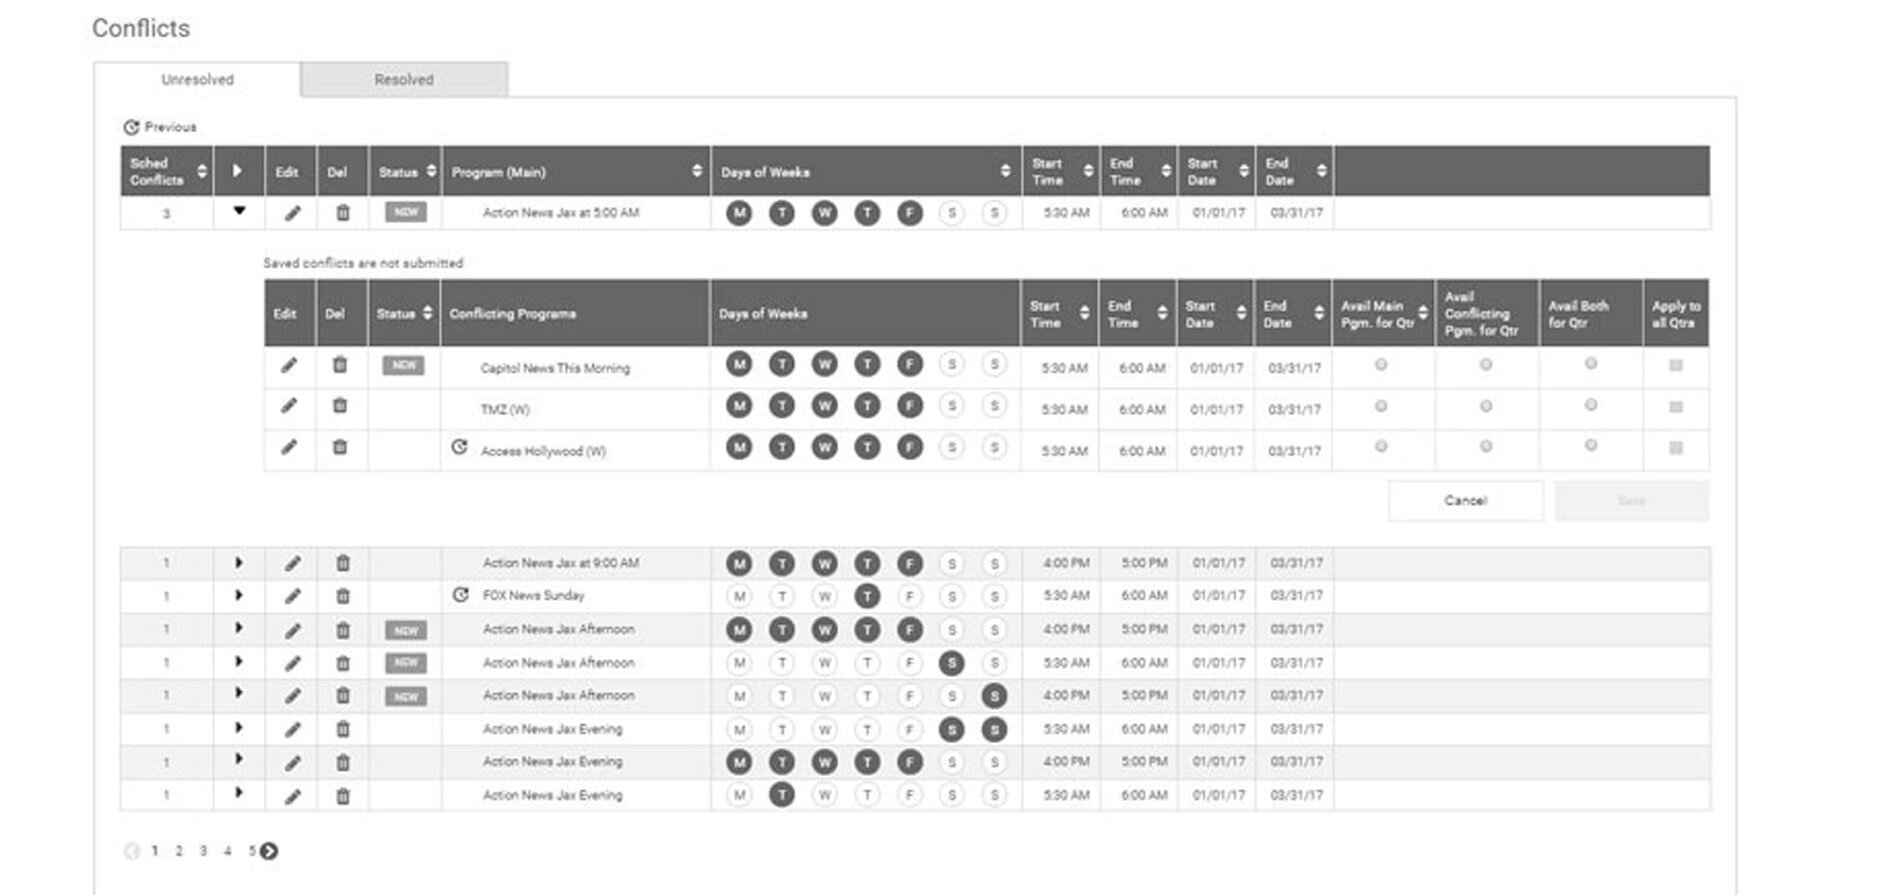
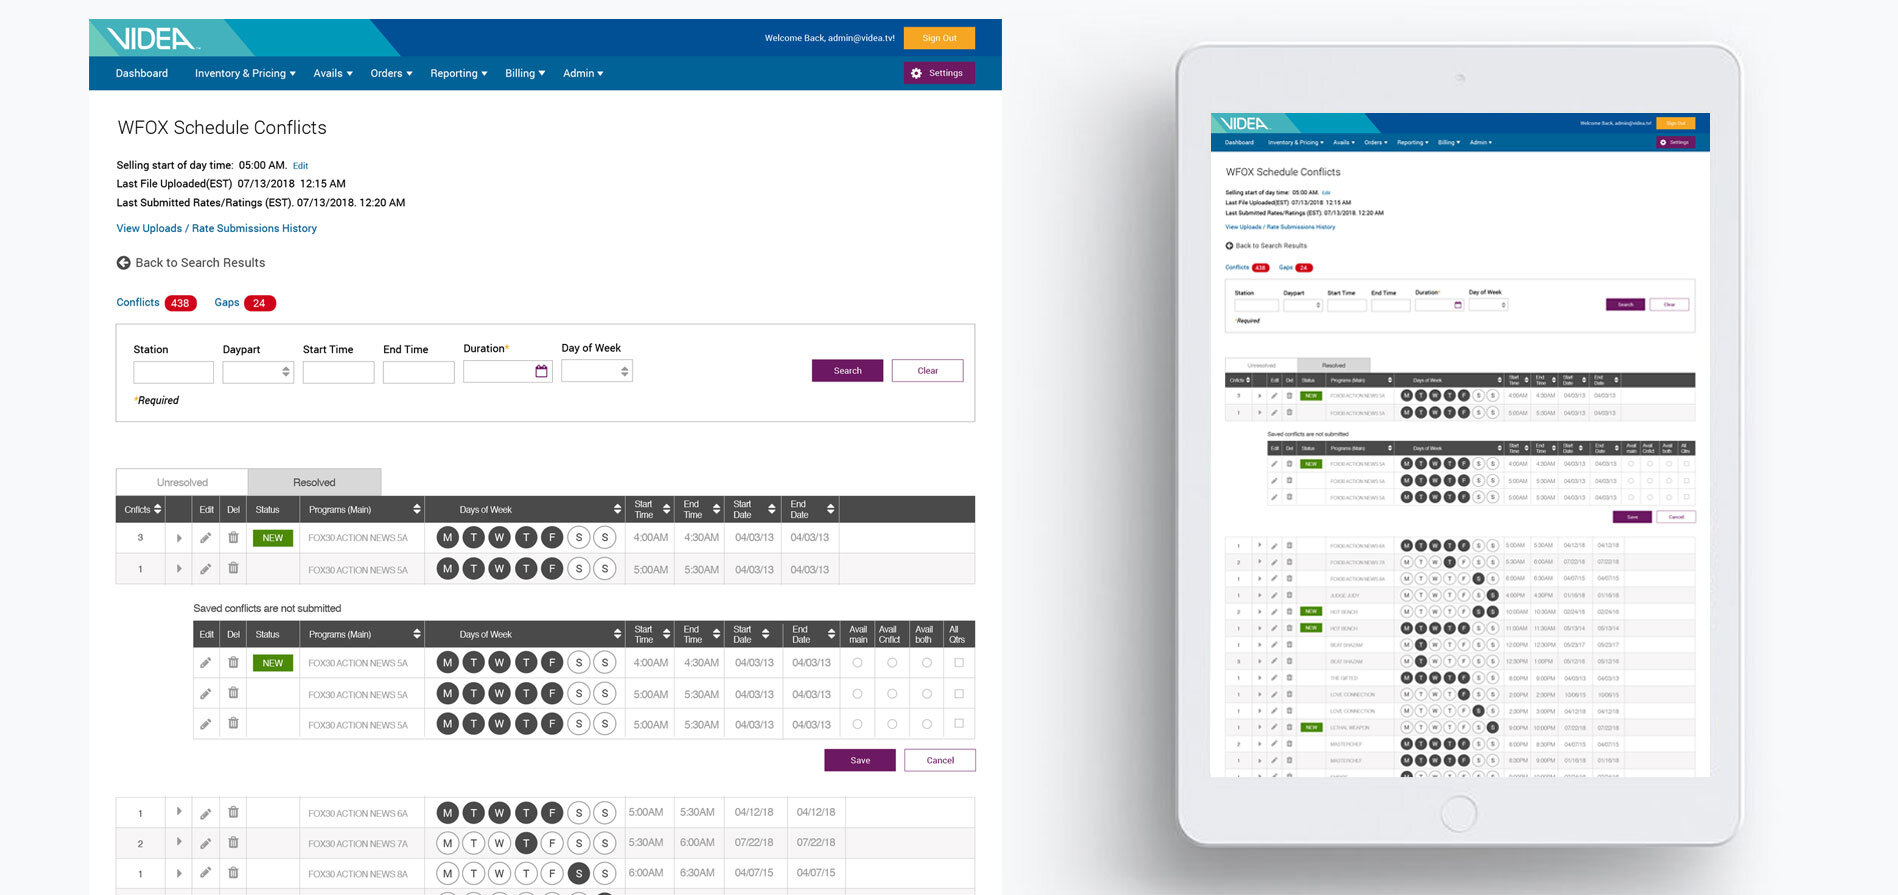
PROGRAM CONFLICTS: Designed Program Conflicts interface which consolidated, identified, managed and reconciled conflicts in the station's schedule.
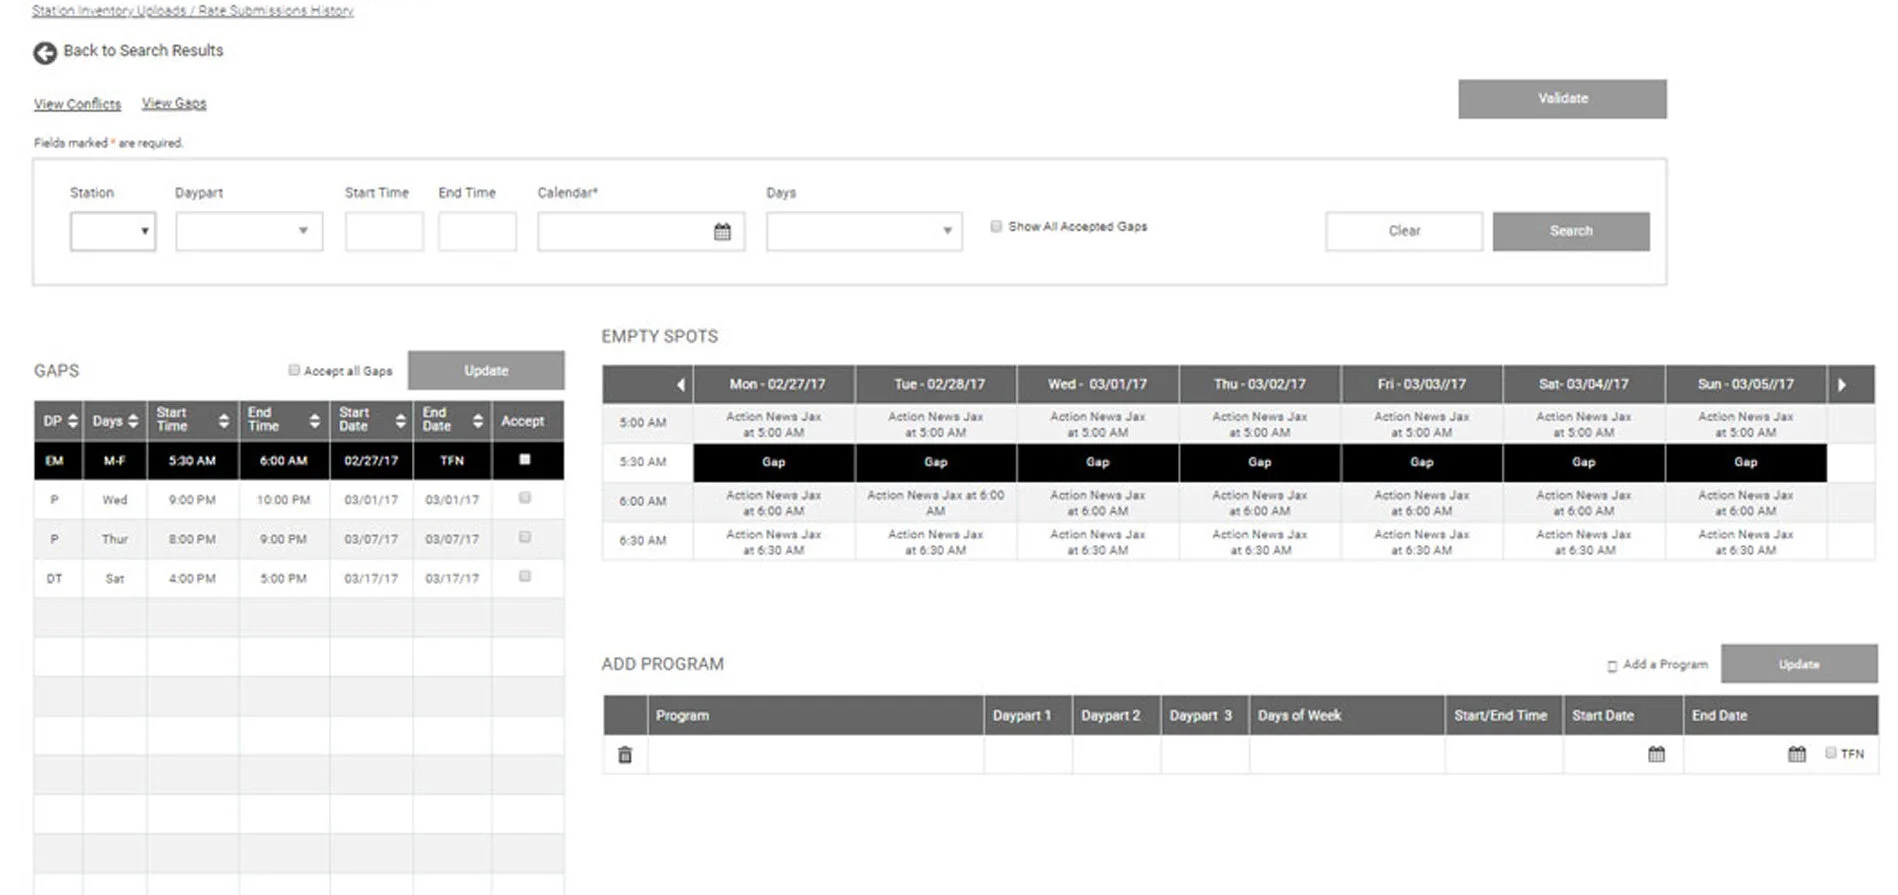
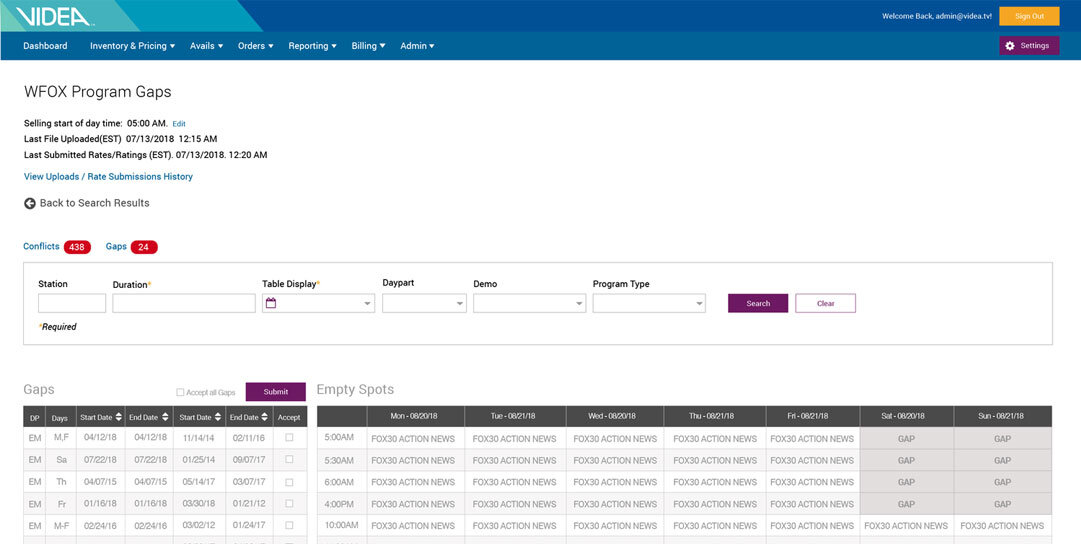
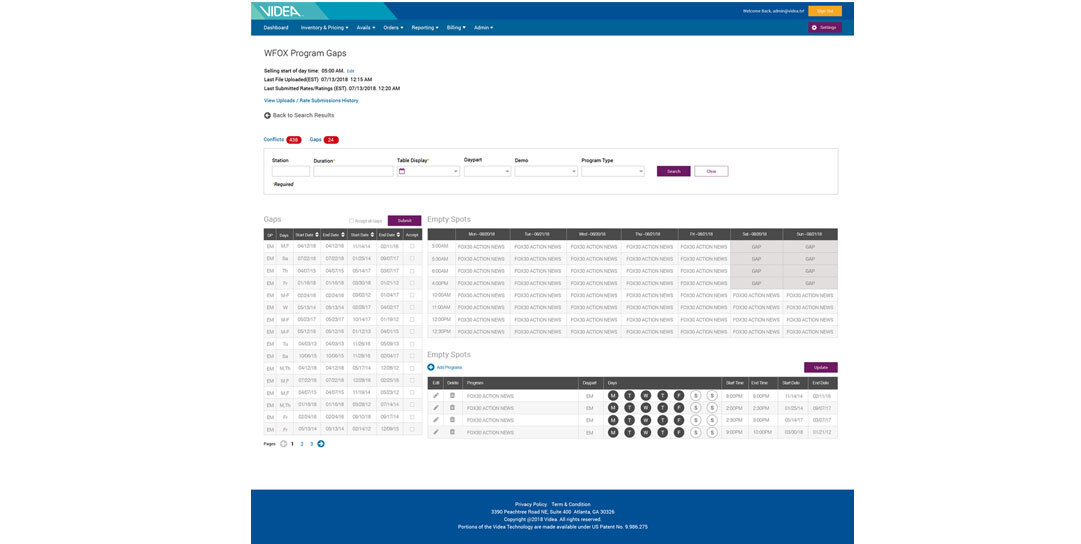
PROGRAM GAPS: Designed Program Gaps interface that provided a resource for stations to immediately identity available programming slots. Station could then reconcile gaps with agency offerings without losing potential revenue.
ROLE: Senior UX/UI Designer; User Researcher
TOOLS: Axure, Adobe Illustrator, TFS
TEAM: 2 User Researchers, 1 UX/UI Designer, Product Owner, Business Analyst, Front and Back End Developers
STYLEGUIDE
PALETTE
Videa Transact’s color palette used throughout product.
TYPOGRAPHY
The Roboto font family was chosen to use in product.


PROCESS
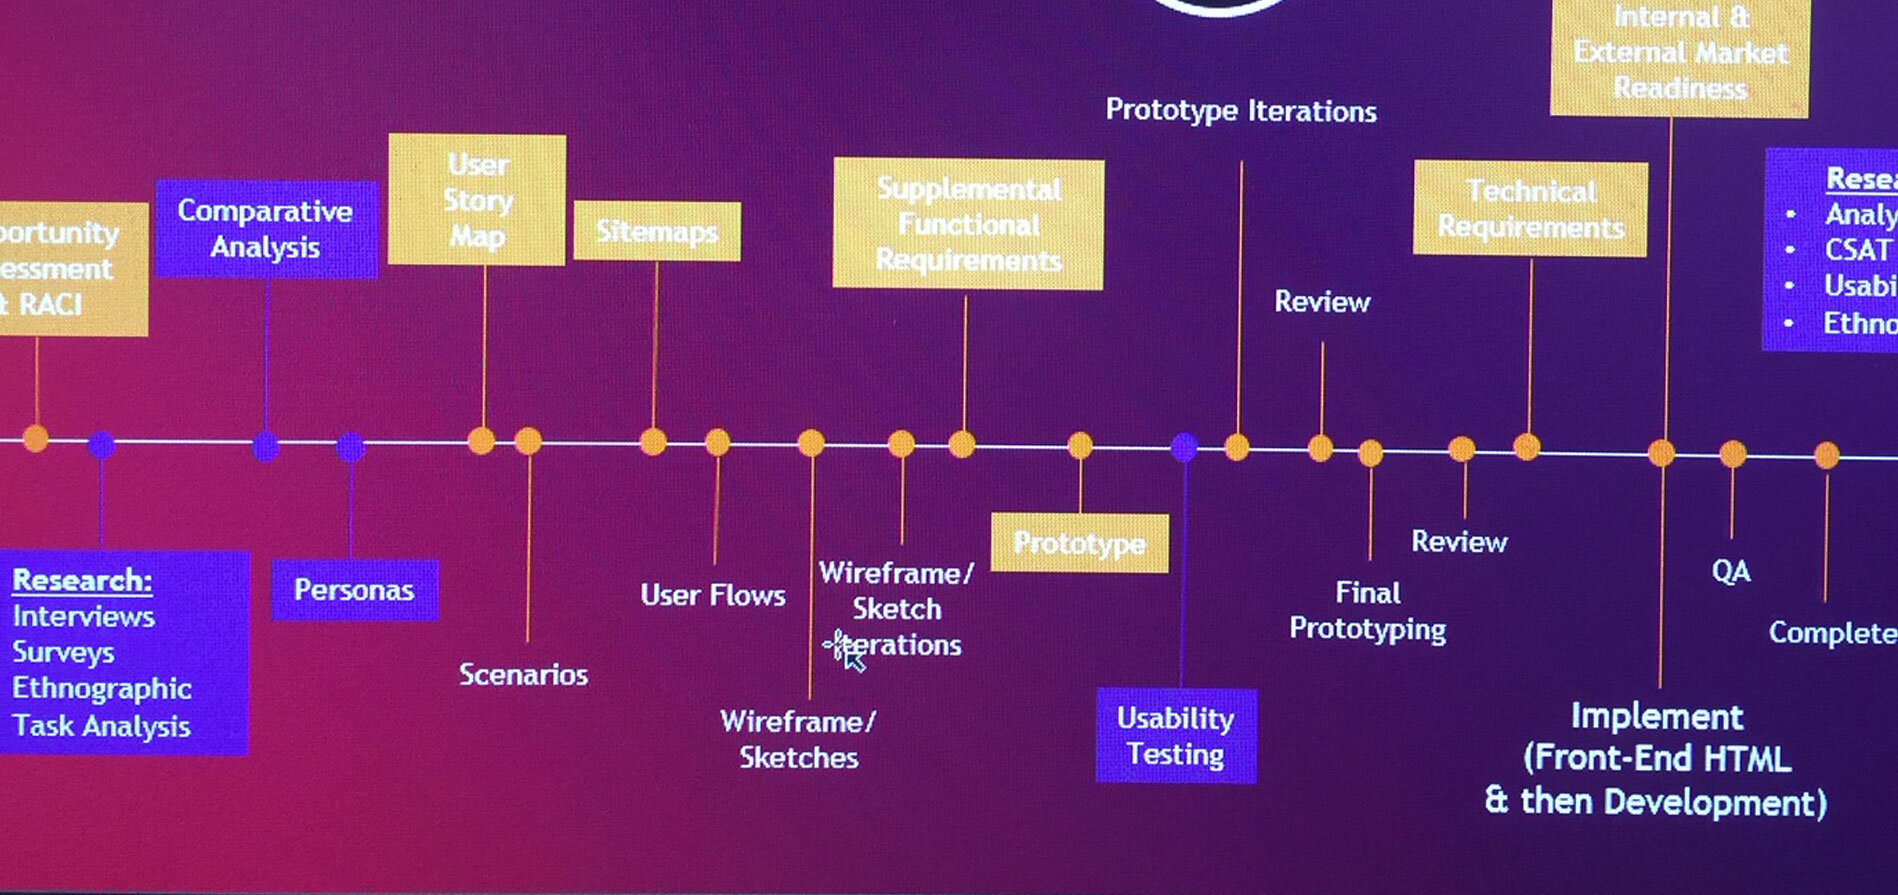
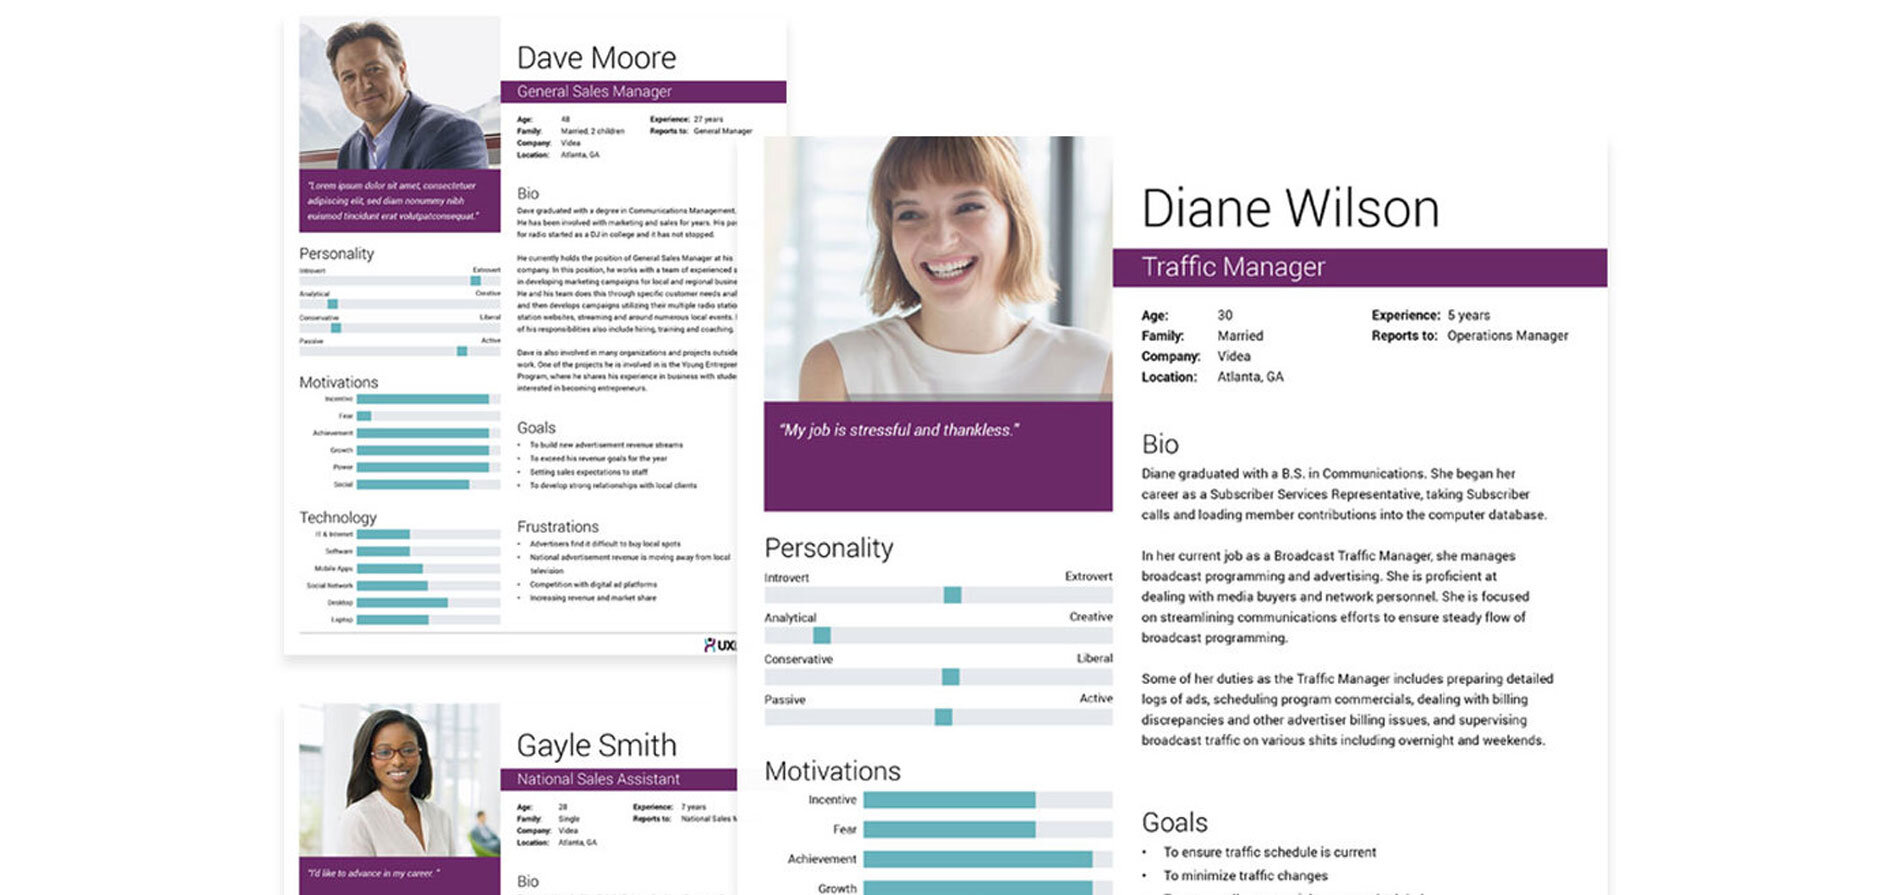
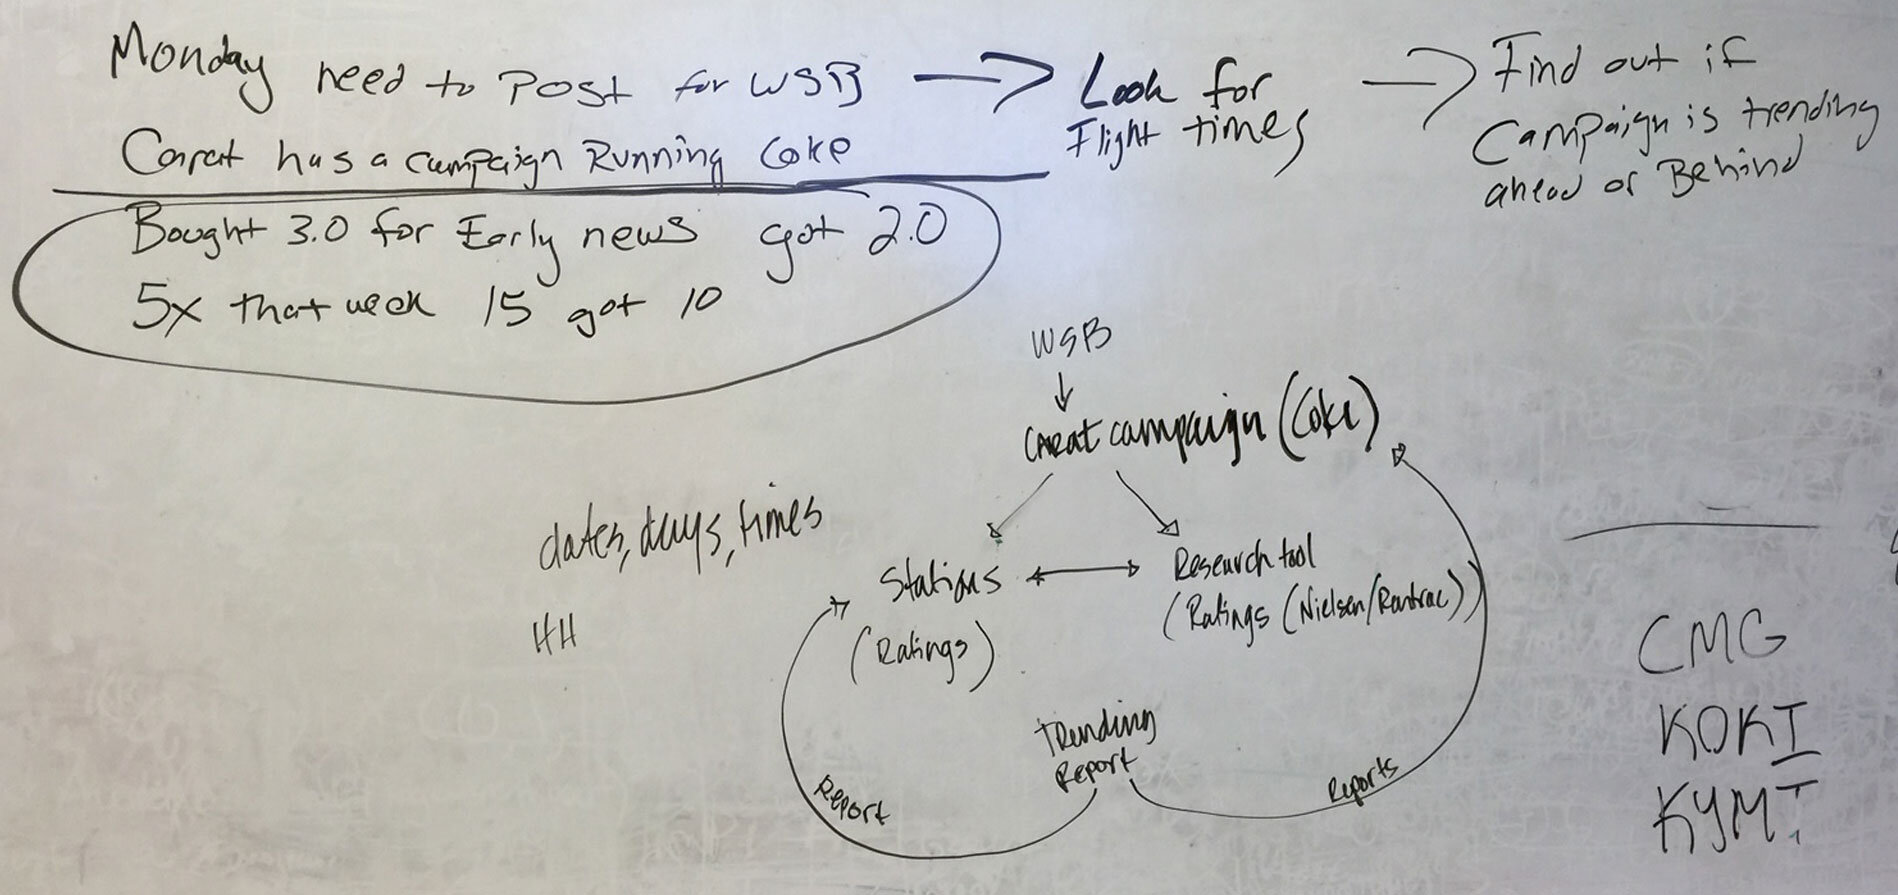
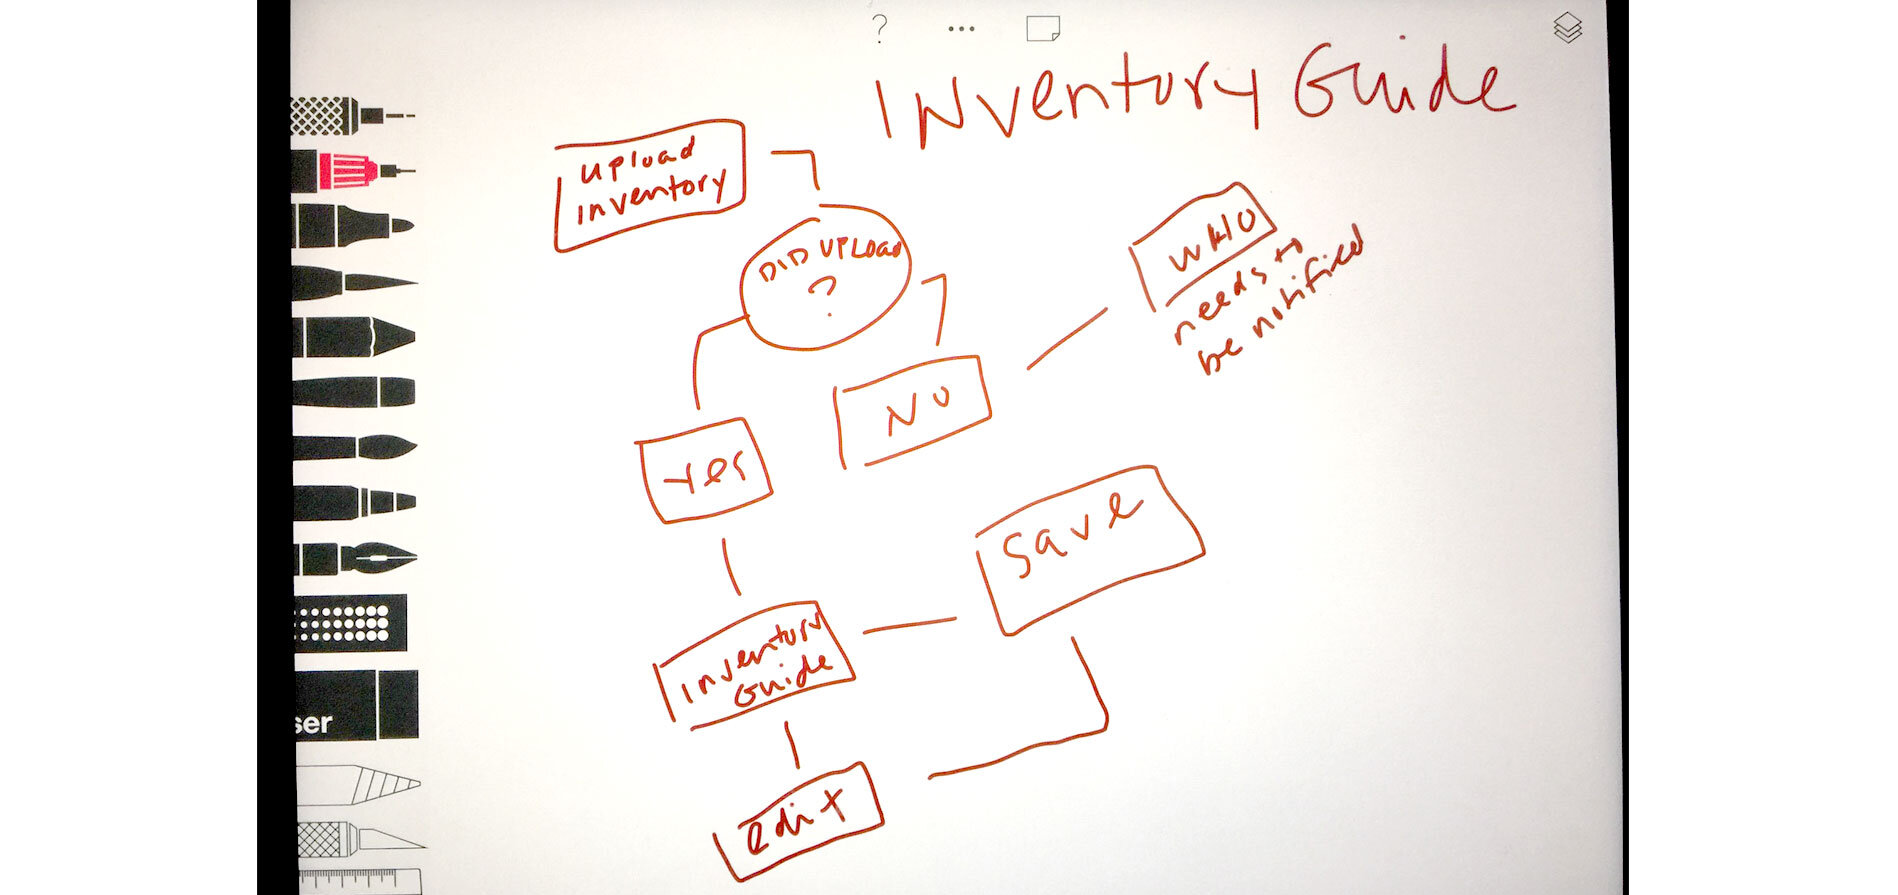
I used several methodologies of UX and research to gather information, develop user flows, create wireframes, test and iterate off of feedback. Here are some samples:
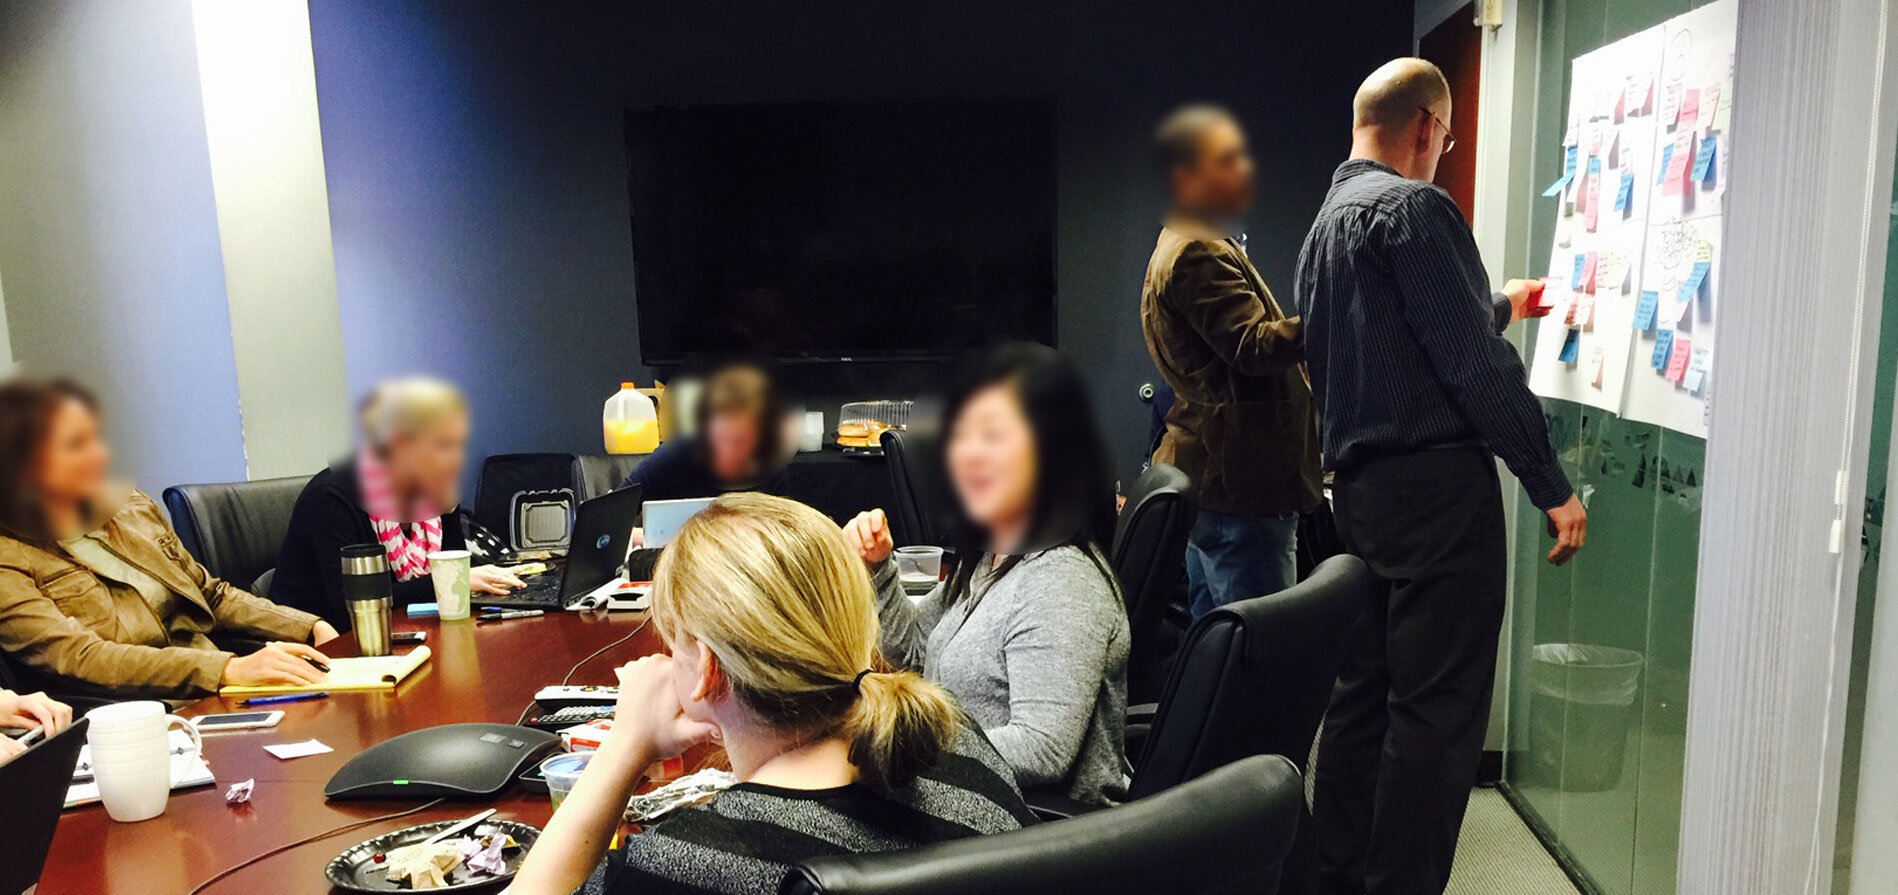
User testing with internal clients
User testing with remote clients
PROTOTYPE
I kept design simple and let the data design itself. This user-minded approach made the interface intuitive and simple to navigate. Design decisions enabled stations to respond quickly and manage critical data that impacts their revenue.

VALIDATION
After earlier successes and positive user feedback of the features I created, I was asked to redesign the Inventory Schedule Guide. I interviewed several stations, documented their feedback, reviewed their pain points and designed a solution that was widely adopted. Efforts produced $5 million in sales with ultimate projection of $50 million in the following three months.